Um post do Jeff Masters do WU:
E outro do Gavin Schmidt referido no anterior
Is the globe cooling?
Recently, one has been hearing statements in the media like, the "twelve-month long drop in world temperatures wipes out a century of warming" and the Earth has been cooling since 1998. Let's take a look at the validity of these statements. The warmest year on record, according to both NASA and NOAA's National Climatic Data Center (NCDC), was 2005. However, 1998 was virtually tied with 2005 for warmth, and the United Kingdom Hadley Center and Climatic Research Unit data set (HadCRU) rates 1998 as the warmest year on record. The three data sets use different methods, such as how they interpolate over missing data regions over the Arctic Ocean, and so they arrive at slightly different numbers for the the global average temperature. All three data sets are considered equally valid, so ignoring two of the three major data sets to claim that the globe has been cooling since 1998 is "cherry picking" the data to show the result you want.
Furthermore, 1997-1998 El Niño event was the second strongest of the past century. El Niño events directly warm a large part of the Pacific, and indirectly warm (via a large increase in water vapor), an even larger region. This extra warming--estimated to have boosted the global temperature an extra 0.1-0.2°C--made 1998's warmth spike sharply upwards from the globe's usual temperature. The climate is best measured by a multi-year average of global temperatures, in order to remove shorter-term oscillations in weather patterns like El Niño. It is not scientifically valid to base a cooling argument on a year that spiked sharply upwards from the norm because of one the largest El Niño events in recorded history. A valid way to measure whether the globe is warming or cooling is to use the average global temperature for the past ten years or longer. The 1999-2008 period was significantly warmer (by 0.18°C, according to NOAA) than the previous ten year period, despite the fact the record (or near-record) warmest year 1998 was part of this previous period. Thus, it is scientifically correct to say the globe has been warming since 1998, not cooling. This warming rate has been about 0.16°C per decade over the past thirty years. Note that even over time periods as long as eight years, the average global temperature is not always a good measure of the long-term global warming trend--particularly if a large volcanic eruption in the tropics occurs.
How often should we expect to see a new global temperature record?
The climate should warm at a rate of about 0.19°C (0.34°F) per decade, according to the computer climate models used to formulate the "official word" on climate, the 2007 report of the Intergovernmental Panel on Climate Change (IPCC). Thus, we should expect to see frequent "warmest years on record". However, 2006, 2007, and 2008 were all cooler than 2005, and 2008 was merely the ninth warmest year on record. We know that the weather has a high degree of natural variability, with warmer than average years mixed in with cooler ones. How often, then, should we expect to set a new global temperature record if the climate is warming in accordance with global warming theory?

Figure 1. Predicted and observed global annual average temperatures between 1990-2008. The thin colored lines represent 55 individual runs of the twenty computer climate models used to formulate the 2007 IPCC report. These runs were done for the A1B "business as usual" scenario, which most closely matches recent emissions. The thick black line is the multi-model mean, and the thick colored lines with symbols denote actual observations, as computed by the three major research groups that estimate annual global temperatures. The sharp down spike in 1991-1992 is due to the eruption of Mt. Pinatubo, which cooled the Earth for two years. You can make these type of plots yourself, using the publicly available PCMDI IPCC AR4 archive. Image credit: Dr. Gavin Schmidt, realclimate.org.
The twenty models used to formulate the 2007 IPCC report (Figure 1) all predict the climate will warm, but with a lot of year-to-year variability due to natural weather patterns such as El Niño. Some of the IPCC models forecast periods lasting many years (in the extreme case, twenty years) with no global warming, due to natural climate and weather oscillations. If one plots up the cumulative distribution of these IPCC model runs to see how often a global average temperature record should be broken (Figure 2), one sees that the models predict a 50% chance that we'll unambiguously break the record every six years. By an unambiguous record, I mean a record that exceeds the previous one by at least 0.1°C. We've now gone ten years without unambiguously breaking the global temperature record, which the models say should happen 25% of the time. There is a 5% chance we'll go eighteen years without unambiguously breaking the record, so it is quite possible for natural variability in the climate system to obscure the global warming signal for periods of nearly twenty years. If we still haven't had a new global temperature record by 2018, then it is time to question global warming theory. If the theory is correct, there is a good chance that we will break the global temperature record during the next year that has a moderate or stonger El Niño event (and no major volcanic eruption in the tropics, since such major eruptions can dramatically cool the climate). Since we have La Niña conditions to start 2009, it is unlikely this year will break the record.

Figure 2. Cumulative distribution of how long one would have to wait for a new global temperature record to be set between the years 1990 and 2030. Image is based on the twenty climate models used to formulate the 2007 IPCC report, using the A1B "business as usual" scenario. The curves should be read as the percentage chance of seeing a new record (Y axis) if you waited the number of years on the X axis. The two curves are for a new record of any size (black) and for an unambiguous record (> 0.1°C above the previous record, red). The 95% confidence line is marked in gray. The main result is that 95% of the time, a new record will be seen within 8 years, but that for an unambiguous record, you need to wait for 18 years to have similar confidence. Image credit: Realclimate.org.
Is global warming slowing down?
The global average temperature has declined over the past three years (Figure 1) and global average sea surface temperature (SST) has not increased over the past seven years (Figure 3). Is global warming slowing down, then, and taking a break? That was the theory advanced by a group of German climate modelers (Keenlyside et al., 2008) in the journal Nature in 2008. Using a climate model that offered a unique way to handle the initial distribution of SSTs, they concluded that over the next ten years, natural variations in the climate may temporarily mask the global warming due to greenhouse gases. They stated: "North Atlantic SST and European and North American surface temperatures will cool slightly, whereas tropical Pacific SST will remain almost unchanged. Our results suggest that global surface temperature may not increase over the next decade, as natural climate variations in the North Atlantic and tropical Pacific temporarily offset the projected anthropogenic warming". However, they go on to state that greenhouse-gas driven global warming will resume full-force after the ten-year break is over. Other climate modelers disagree with this predicted "break" in global warming. Both theories are reasonable ones, and it is possible that the recent cool years portend the ten-year "break" from global warming hypothesized by Keenlyside et al. It is too early to tell, since the relative coolness of the past few years could easily be natural "noise" (weather) imposed on the long-term global warming trend. The fact that we've had a cold winter in eastern North America and in the UK--or any other anecdotal cold or snow-related record you may hear about--can't tell us whether global warming may be slowing down or not. The amount of global warming over the past century has only been about 1.3°F (0.74°C). Thus, it should not surprise us, for example, if temperatures during tonight's hard freeze in Florida bottom out at 25°F, instead of the 24°F it would have reached 100 years ago. The long-term ten and thirty year trends in global temperature are solidly upwards in accordance with global warming theory, and claims that the globe is cooling cannot be scientifically defended.

Figure 3. Global average sea surface temperatures (SSTs) from 1990-2008. SSTs have not increased in the past seven years. Image credit: NASA/GISS.
References
Keenlyside, N.S., M. Latif, J. Jungclaus, L. Kornblueh, and E. Roeckner, 2008, "Advancing decadal-scale climate prediction in the North Atlantic sector", Nature 453, No. 7191, pp. 84-88, May 1, 2008
Further reading
2008 temperature summaries and spin by Gavin Schmidt of realclimate.org.
http://www.wunderground.com/blog/JeffMasters/comment.html?entrynum=1187
E outro do Gavin Schmidt referido no anterior
2008 temperature summaries and spin
The great thing about complex data is that one can basically come up with any number of headlines describing it - all of which can be literally true - but that give very different impressions. Thus we are sure that you will soon read that 2008 was warmer than any year in the 20th Century (with the exception of 1998), that is was the coolest year this century (starting from 2001), and that 7 or 8 of the 9 warmest years have occurred since 2000. There will undoubtedly also be a number of claims made that aren't true; 2008 is not the coolest year this decade (that was 2000), global warming hasn't 'stopped', CO2 continues to be a greenhouse gas, and such variability is indeed predicted by climate models. Today's post is therefore dedicated to cutting through the hype and looking at the bigger picture.
As is usual, today marks the release of the 'meteorological year' averages for the surface temperature records (GISTEMP, HadCRU, NCDC). This time period runs from December last year through to the end of November this year and is so-called because of the fact that it is easier to dice into seasons than the calendar year. That is, the met year consists of the average of the DJF (winter), MAM (spring), JJA (summer) and SON (autumn) periods (using the standard shorthand for the month names). This makes a little more sense than including the JF from one winter and the D from another as you do in the calendar year calculation. But since the correlation between the D-N and J-D averages is very high (r=0.997), it makes little practical difference. Annual numbers are a little more useful than monthly anomalies for determining long term trends, but are still quite noisy.
The bottom line: In the GISTEMP, HadCRU and NCDC analyses D-N 2008 were at 0.43, 0.42 and 0.47ºC above the 1951-1980 baseline (respectively). In GISTEMP both October and November came in quite warm (0.58ºC), the former edging up slightly on last month's estimate as more data came in. This puts 2008 at #9 (or #8) in the yearly rankings, but given the uncertainty in the estimates, the real ranking could be anywhere between #6 or #15. More robustly, the most recent 5-year averages are all significantly higher than any in the last century. The last decade is by far the warmest decade globally in the record. These big picture conclusions are the same if you look at any of the data sets, though the actual numbers are slightly different (relating principally to the data extrapolation - particularly in the Arctic).
So what to make of the latest year's data? First off, we expect that there will be oscillations in the global mean temperature. No climate model has ever shown a year-on-year increase in temperatures because of the currently expected amount of global warming. A big factor in those oscillations is ENSO - whether there is a a warm El Niño event, or a cool La Niña event makes an appreciable difference in the global mean anomalies - about 0.1 to 0.2ºC for significant events. There was a significant La Niña at the beginning of this year (and that is fully included in the D-N annual mean), and that undoubtedly played a role in this year's relative coolness. It's worth pointing out that 2000 also had a similarly sized La Niña but was notably cooler than this last year.
While ENSO is one factor in the annual variability, it is not the only one. There are both other sources of internal variability and external forcings. The other internal variations can be a little difficult to characterise (it isn't as simple as just a super-position of all the climate acronyms you ever heard of NAO+SAM+PDO+AMO+MJO etc.), but the external (natural) forcings are a little easier. The two main ones are volcanic variability and solar forcing. There have been no climatically significant volcanoes since 1991, and so that is not a factor. However, we are at a solar minimum. The impacts of the solar cycle on the surface temperature record are somewhat disputed, but it might be as large as 0.1ºC from solar min to solar max, with a lag of a year or two. Thus for 2008, one might expect a deviation below trend (the difference between mean solar and solar min, and expecting the impact to not yet be fully felt) of up to 0.05ºC. Not a very big signal, and not one that would shift the rankings significantly.
There were a number of rather overheated claims earlier this year that 'all the global warming had been erased' by the La Niña-related anomaly. This was always ridiculous, and now that most of that anomaly has passed, we aren't holding our breath waiting for the 'global warming is now back' headlines from the same sources.
Taking a longer perspective, the 30 year mean trends aren't greatly affected by a single year (GISTEMP: 1978-2007 0.17+/-0.04ºC/dec; 1979-2008 0.16+/-0.04 - OLS trends, annual data, 95% CI, no correction for auto-correlation; identical for HadCRU); they are still solidly upwards. The match of the Hansen et al 1988 scenario B projections are similarly little affected (GISTEMP 1984-2008 0.19+/-0.05 (LO-index) 0.22+/-0.07 (Met-station index); HansenB 1984-2008 0.25+/-0.05 ºC/dec) - the projections run slightly warmer as one would expect given the slightly greater (~10%) forcing in the projection then occurred in reality. This year's data then don't really change our expectations much.
Finally, as we've discussed before, what climate models did or did not predict is available for all to see. Despite many cautions about using short-term changes to imply something about the long-term trend, these comparisons will still be made. So just for fun, here is a comparison of the observations with the model projections from 1999 to 2008 using 1999 as a baseline. The answer might be surprising for some:
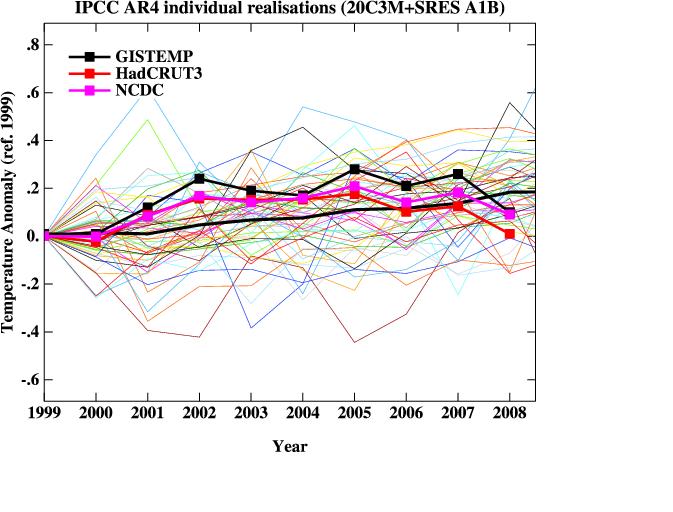
You can get slightly different pictures if you pick the start year differently, and so this isn't something profound. Picking any single year as a starting point is somewhat subjective and causes the visual aspect to vary - looking at the trends is more robust. However, this figure does show that in models, as in data, some years will be above trend, and some will be below trend. Anyone who expresses shock at this is either naive or … well, you know.
As for the next few years, our expectations are not much changed. This coming winter is predicted to be ENSO neutral, so on that basis one would expect a warmer year next year than this year (though probably not quite record breaking). Barring any large volcanic eruption, I don't see any reason for the decadal trends to depart much from the anticipated ~0.2ºC/decade.
Update: Just FYI, the same figure as above baselined to 1990, and 1979.
http://www.realclimate.org/index.php/archives/2008/12/2008-temperature-summaries-and-spin/


")


")
