Aquecimento Global

  • Thread starter Thread starter Minho
  • Data de início Data de início
Neste momento a população da França e do Reino Unido já estão com crescimento natural (acho que o mesmo acontece em Portugal e outros países) e a coisa está a ir de tal maneira que, por este caminho, não tarda se estará a falar em explosão demográfica. E eu disse crescimento natural, nem conta com a imigração, senão então...

Correcção: Portugal cresceu nos últimos anos devido à imigração... e se verificarmos as comunidades estrangeiras em certos paises, verificamos que em boa parte da Europa não existiu crescimento natural.

Um estudo populacional sobre Portugal:

http://www.marktest.com/wap/a/n/id~1237.aspx


Mas isto é outro assunto.
 
"Mas isto é outro assunto."

Certamente que é. Eu só quis mostrar que não está em curso a regressão demográfica catastrófica que ainda há pouco todos os iluminados e as "altas instâncias" vaticinavam. Pelo contrário, parece que, a manter-se a actual tendência, o Reino Unido até vai duplicar a população nas próximas décadas. Haja pão.

Correcto. :thumbsup:
 
Ban Ki-moon alerta que mundo segue para o abismo com aquecimento global

O secretário-geral da ONU, Ban Ki-moon, manifestou espanto nesta quinta-feira em Genebra com a aceleração do aquecimento global e alertou que o mundo caminha para o abismo. "Temos o pé afundado no acelerador e caminhamos para o abismo", declarou Ban na conferência sobre o clima que está reunida em Genebra desde o início da semana.

Eu vou confessar que não gosto muito do senhor Ban Ki-moon. Nos últimos dois anos vi-o associar ciclones no Bangladesh ao aquecimento global, associações que achei erradas ou mesmo abusivas na altura.

Eu compreendo que alguns líderes tenham que ser dramáticos a tentar fazer passar a mensagem, mas continuo a achar que este tipo de coisas não deve ser feito assim, deve ser sempre feito de forma cientifica e ponderada.

Ban Ki-moon deve saber muito melhor do que eu, que a luta contra o aquecimento global implica sacrifícios, reduzir emissões com o tipo de economia global que temos significa em muitos países criar pobreza e remeter nos países menos desenvolvidos milhões de pessoas para pobreza e fome, senão mesmo a morte.

Reduzir emissões à escala global é uma tarefa necessária mas muito complicada, com consequências que tem que também ser ponderadas. Não é nada simples esse caminho, e acho que pessoas como Ban Ki-moon deveriam estar preocupados com essa dificuldade. Porque da forma como fala, dá a ideia de que tudo é fácil, basta urgentemente reduzir as emissões. Mas não é nada assim., isto é uma coisa bastante complexa.

Parece óbvio que a nossa sociedade tal como a que conhecemos caminha para o abismo, mas não acham que deveria ser feito um maior esforço mundial por exemplo a nível da demografia ?
 
Parece óbvio que a nossa sociedade tal como a que conhecemos caminha para o abismo, mas não acham que deveria ser feito um maior esforço mundial por exemplo a nível da demografia ?

Na minha modesta opinião, neste momento devem ser feitos todos os esforços possíveis no sentido do desenvolvimento e exploração das fontes energéticas alternativas do petróleo. Especialmente ao nível da produção de electricidade.

Se a humanidade não for bem sucedida neste particular, o fenómeno da carestia, escassez e esgotamento do petróleo, vai produzir uma revolução mundial de tal magnitude (revolução económica, social, demográfica, política, etc) que no futuro, os sobreviventes, vão olhar para o passado e vão rir-se desses tipos que se preocupavam com o crescimento demográfico, o aquecimento global, etc etc; exactamente da mesma maneira que nós hoje nos rimos dos indivíduos que há seiscentos anos atrás discutiam sobre quantos anjos podiam dançar na ponta de um alfinete e se Sócrates e Platão estavam no inferno por terem nascido antes de Cristo, e não serem cristãos, obviamente.
 
Parece óbvio que a nossa sociedade tal como a que conhecemos caminha para o abismo, mas não acham que deveria ser feito um maior esforço mundial por exemplo a nível da demografia ?

Viva!

Sobre a população, algumas reflexões:

http://climateandcapitalism.com/?p=689

http://climateandcapitalism.com/?p=581

«Populationists tend to downplay the question of power. As renowned US ecologist Barry Commoner commented, populationist solutions to environmental destruction are “equivalent to attempting to save a leaking ship by lightening the load by forcing passengers overboard”.»
 
Parece óbvio que a nossa sociedade tal como a que conhecemos caminha para o abismo, mas não acham que deveria ser feito um maior esforço mundial por exemplo a nível da demografia ?

Sem dúvida.

Mas penso que será mais premente esse facto a nível de alimentação, mesmo sem contar com alterações climáticas.

Difícil de entender é a maioria dos países usarem o crescimento demográfico como base de uma economia sustentável.
 
É claro que o problema demográfico é um problema real. Por este andar, o planeta terá dificuldade em suportar tanta gente. No entanto, no presente, esse não é o caso. Não é por falta de alimentos que há fome! As razões têm que ser encontradas em factores de ordem económica, de poder (políticas), etc.

Mas o problema demográfico não é O FACTOR, nem de longe nem de perto, mais importante, do ponto de vista das alterações climáticas. Basta ter em conta, por exemplo, os valores da pegada ecológica:

http://www.footprintnetwork.org/en/index.php/GFN/page/footprint_for_nations/
Indicam-se os valores da população e da pegada ecológica:
North America: 330,5 9,2
Canada 32,3 7,1
United States of America 298,2 9,4
Europa:
Austria 8,2 5,0
Belgium 10,4 5,1
Bulgaria 7,7 2,7
Czech Republic 10,2 5,4
Denmark 5,4 8,0
Estonia 1,3 6,4
Finland 5,2 5,2
France 60,5 4,9
Germany 82,7 4,2
Greece 11,1 5,9
Hungary 10,1 3,5
Ireland 4,1 6,3
Italy 58,1 4,8
Latvia 2,3 3,5
Lithuania 3,4 3,2
Netherlands7 16,3 4,4
Poland 38,5 4,0
Portugal 10,5 4,4
Romania 21,7 2,9

Asia-Pacific 3.562 1,6
Australia 20,2 7,8
Bangladesh 141,8 0,6
Bhutan 2,2 1,0
Cambodia 14,1 0,9
China 1.323,3 2,1
India 1.103,4 0,9
Indonesia 222,8 0,9
Japan 128,1 4,9
Korea DPRP 22,5 1,6
Korea Republic 47,8 3,7
Laos 5,9 1,1
 
Citando o Vince:

«Aliás, os tempos que vivemos são fascinantes, todos nós estamos a presenciar algo de raro, em que podemos estar a validar uma serie de teorias cientificas em simultâneo com um ciclo solar anómalo em relação às últimas décadas

De facto, Vince, é uma coisa que me espanta neste forum, a forma como está a passar despercebido aquele que porventura é um dos acontecimentos mais interessantes das últimas décadas, e que pode (este sim) provocar uma alteração significativa no nosso clima actual, e que se trata de sucessivos recordes que estão a ser batidos neste mínimo solar que agora atravessamos, no que se refere a número de dias sem manchas solares ... os nossos amigos espanhóis do Meteored têm feito um seguimento espectacular e diário sobre esta evolução e que eu, com grande expectativa, sigo atentamente. :)
 
No blogue Open Mind vem um bom post sobre modelos e os diferentes forçamentos, incluindo o solar. Recomendo a leitura aos muitos que andam sempre aqui a falar do Sol, que às vezes parecem partir do princípio de que a influência solar não é tida em conta, claro que é, e isso já muitas vezes foi repetido aqui.

De todos os forçamentos não há nada que explique o actual aquecimento a não ser a influência antropogénica, e como já disse em anteriores vezes, um hipotético mínimo solar prolongado, que ninguém consegue prever, certamente fará baixar as temperaturas, mas isso não significa que o aquecimento seja revertido ou que a teoria o AGA esteja errada. E é preciso não esquecer que a maioria dos estudos atribui muito mais aos vulcões o arrefecimento da pequena idade do gelo do que aos mínimos solares. Eu quando digo que vivemos tempos fascinantes quero dizer que o problema disto tudo é que não podemos fazer experimentação com o clima, e se a natureza nos resolve servir um mínimo solar diferente do das últimas décadas isso será precioso para validar teorias e modelos, tal como tem sido por exemplo algumas erupções vulcânicas. Ciência é um processo contínuo, e pode perfeitamente haver erros, e um mínimo solar mais prolongado pode ajudar a validar algumas coisas.


Denialists love to denigrate computer models of earth’s climate. In my opinion they only do this because they’re in denial of the result, not because of any valid evidence. They also love to make the false claim that without computer models there’s no reason to believe that global warming is real, and is going to get worse.


The term “computer model” refers to an actual simulation of earth’s climate, often in remarkable detail. Such models are (of course!) not able to predict, or even post-dict, the chaotic aspects of the sytem (the weather), but they do an outstanding job of post-dicting the global statistical characterization of the system (the climate).

But such models and their results are not the topic of this post; I’d like to take a look at some simple models which are not computer models. They’re simple mathematical models of changes in global temperature, and although I’ve used a computer to do the arithmetic, I could have done so without a computer and they are most decidedly not computer models.

Global temperature responds to changes in the energy flow of earth’s climate system. When more energy flows through the system the planet heats up; with less energy flow the planet cools down. Changes in the energy flow constitute climate forcings. We know of many, including greenhouse gases, solar changes, ozone, snow albedo, land use, aerosols (both from volcanoes and from industrial processes), etc. We even have estimates of their magnitude for more than a century. For my mathematical models I’ll use estimates of climate forcing from NASA GISS; the data cover the time span from 1880 through 2003. Here’s the forcing data:

forcings.jpg


The only positive (warming) forcing which has reached a level greater than 1 W/m^2 (watt per square meter) above 1880 levels is greenhouse-gas forcing. The net forcing is strongly positive, but if we leave out greenhouse-gas forcing it’s not:

netforce.jpg


Many investigations of the relationship between climate forcing and global temperature use regression models. For such models, the response to climate forcing is treated as being instantaneous; there’s no (or at least negligible) lag between forcing and response. But that’s not a realistic model; there are many different components to the climate system, each with a different time scale. Hence in addition to simple regression models, I’ll also use a two-box model which allows for both a “prompt” response to climate forcing and a long-term response. This can be thought of as a rough mimicry of an atmosphere-ocean model, where the atmosphere responds quickly while the ocean takes much longer. I’ll allow the atmosphere to respond very quickly (in a single year) while for the oceans I’ll use a timescale of 30 years.

First let’s look at simple regression models, regressing global temperature against net climate forcing:

1boxall.jpg


This model does show an overall increase in global temperature due to an overall increase in climate forcing. But two things are apparent: 1) the long-term trend is underestimated; and 2) the short-term dips (due to volcanic eruptions) are overestimated. It also indicates a climate sensitivity of only 0.25 deg.C/(W/m^2) (this is sensitivity to a forcing increase of 1 W/m^2, not sensitivity to doubling of CO2 concentration). That’s too low a value; the Stefan-Boltzmann equation alone implies a sensitivity of 0.3 deg.C/(W/m^2). Physics tells us that feedbacks in the climate system will make actual climate sensitivity greater than the Stefan-Boltzmann value, and paleoclimate evidence (ice age cycles) requires it.

The reason for the misfit is clear. Volcanic eruptions cause a huge negative (cooling) forcing, but the volcanic aerosols responsible for this forcing settle out of the atmosphere in a year or two so the effect doesn’t last very long, hence the response to a volcanic eruption is notable but not huge. But with only one response “coefficient” (this is a regression model with a single regressor, net forcing) this means the coefficient must be kept small enough not to cause immense cooling for every volcanic eruption. At the same time, long-term forcing changes cause warming, but if we set the regression coefficient small enough to create a good match with volcanic changes we’d see almost no long-term trend at all. Hence the long-term trend forces the coefficient to be big enough to get at least some trend.

The net result is that the regression coefficient is somewhere between the small coefficient of short-term response which matches volcanic changes, and the much larger coefficient of long-term response which matches global warming. As a result, the impact of volcanic eruptions is overestimated and the long-term trend is underestimated.

If we do a similar model using just greenhouse-gas forcing we get a decent (but not impressive) match to the long-term trend but the volcanic dips are now absent:

1boxghg.jpg


The match to warming during the early 20th century isn’t very good. Nonetheless it does show some early-20th-century warming, showing that claims that greenhouse gases had no impact until just recently are mistaken. Greenhouse-gas forcing is probably not the main driver of early-20th-century warming, but it’s not an insignificant factor either. Also this model shows even smaller climate sensitivity than the all-forcings regression model, a mere 0.24 deg.C/(W/m^2). However, the match to the long-term trend since 1975 is not bad, indicating that perhaps greenhouse-gas forcing is the main driver of global warming over the last 35 years or so.

If we use all climate forcings except greenhouse gases we get this:


1boxnoghg.jpg


Now the fit is dreadful! Also, the coefficient is of the wrong sign: the climate sensitivity using this model is -0.13 deg.C/(W/m^2), indicating that an increase in climate forcing causes cooling! What has happened is that without greenhouse-gas forcing, there’s simply no explanation for modern warming, so the model has fit the only variation it can find (modern volcanic eruptions) to recent warming, but had to reverse the sign to get any kind of match at all. Of course this model is nonsense.

If we try a simple regression model using just solar forcing, we can get a decent fit to early-20th-century warming but not to recent warming:


1boxsol.jpg


While the fit to the early-20th-century trend is not bad, the fluctuations of the solar (11-year) cycle just don’t match. This indicates that the coefficient from this model is probably too big — solar-cycle changes don’t cause that much warming and cooling. This is confirmed by examination of the coefficient from this model, indicating climate sensitivity of a whopping 1.73 deg.C/(W/m^2).

The fact is that while solar forcing is responsible for some of the early-20th-century warming, it didn’t cause all of it. The regression-on-solar-only model therefore must inflate the sensitivity to get a match. Even with inflated sensitivity it still doesn’t reproduce recent warming; solar output hasn’t increased.

The upshot of all the simple regression model results is that simple regression models (corresponding to prompt response to climate forcing) just don’t do the trick. Too little prompt response fails to show the trend we’ve observed, while too much prompt response exaggerates the effect of volcanic eruptions. Clearly we need to combine prompt response with long-term response in order to get a realistic picture of temperature change; that’s the purpose of the two-box model.

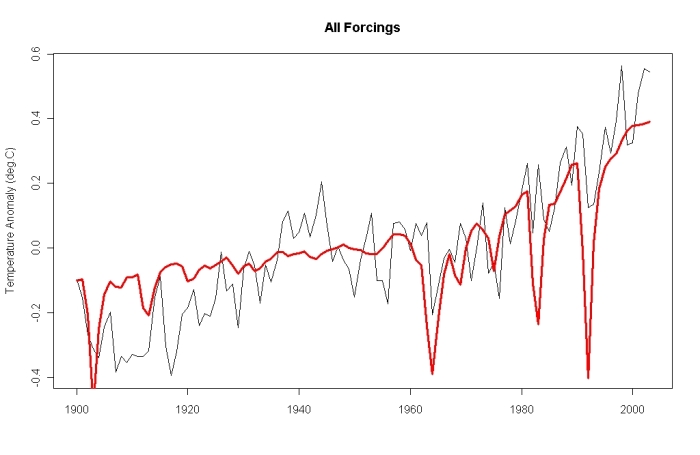
In fact the two-box model using all climate forcings does a good job fitting the observed data:

2boxall.jpg


Both the early-20th-century and recent warmings are well modeled; the greatest mismatch is during the 1937-1945 period. It’s possible that some (if not most) of this mismatch is in the temperature data rather than the model, a result of the “bucket problem” with ocean temperature data-collection before and during world war II.

Another encouraging result of this model is that it yields a climate sensitivity of 0.73 deg.C/(W/m^2) (a sensitivity of 2.7 deg.C to doubling of CO2). This is well in line with the results of computer models; the GISS modelE shows a sensitivity of 0.68 deg.C/(W/m^2).

If we fit a two-box model but leave out greenhouse-gas forcing we get this:


2boxnoghg.jpg


Once again, without greenhouse-gas forcing the fit is dreadful. The only reason it matches recent warming is that it has turned the long-term forcing coefficient upside-down, and this model also shows a nonsensical negative climate forcing of -0.77 deg.C/(W/m^2). It emphasizes that without greenhouse-gas climate forcing (which is the result of human activity), climate models — even noncomputer models like these — just don’t fit.

I’ll close with a two-box model, which includes all climate forcings and includes the southern oscillation index to mimic some of the short-term changes in temperature. The SOI isn’t really climate forcing since it’s not adding or removing energy from the ocean-atmosphere system, it’s exchange between ocean and atmosphere. Nonetheless it is related to changes in surface temperature (which is what we’re modeling). I’ve allowed a 7-month lag for SOI to have an effect. I also computed a model allowing SOI to have a long-term effect, just as though it were a climate forcing — but the long-term impact of the SOI turned out not to be statistically significant. Here’s the result of the model including all forcings and short-term SOI effects:

2boxallsoi.jpg


The fit is excellent. The climate sensitivity indicated by this model is 0.69 deg.C/(W/m^2), extremely close to the sensitivity estimated from the (much more sophisticated) GISS modelE (computer) model of 0.68.

Many of you have seen the graphs (included in the IPCC reports) showing that using computer models, we can reproduce temperature history if we include human factors, but not if we omit them. That’s such powerful evidence that we’re the cause of global warming, it’s no wonder denialists have tried so hard to slander computer models and to insist that without them there’s no solid evidence of man-made global warming. The truth is that you don’t need computer models to show this. Even with very simple mathematical models (and these models are indeed simple) the result is the same. Without human causation, there’s no explanation for the global warming we’ve already observed. With human causation, there’s no explanation for a lack of global warming.

http://tamino.wordpress.com/2009/08/17/not-computer-models/
 
Outro interessante post no mesmo blogue aborda os efeitos da obliquidade do eixo da Terra e da elipticidade da órbita da Terra e que já se tem falado neste tópico.

O que se passa é que de acordo com os cálculos efectuados, nós actualmente ainda deveríamos estar numa fase de arrefecimento do Árctico por exemplo, mas este tem estado a aquecer nas últimas décadas.


One of the most interesting aspects of the arctic hockey stick is that until the recent and sizeable man-made warming, arctic temperatures weren’t flat, they were actually declining. This is no surprise at all, because orbital factors have a strong influence on polar temperature; in fact they’re the trigger for ice ages. It turns out that the orbital changes over the last 10,000 years have had a cooling influence on the arctic.

The phrase “orbital factors” in this context actually includes an astronomical aspect which is not orbital: the earth’s obliquity. Obliquity is the angle by which our planet is tilted relative to its orbit. The earth’s axial tilt is what gives us our seasons, but the amount of that tilt (the obliquity) is not perfectly constant; it varies between a minimum of about 22o and a maximum of about 24.5o. When the tilt is greater, the poles receive more energy from the sun, both at the peak of midsummer and averaged throughout the year. Obliquity is currently in decline, as it has been since about 10,000 years ago:

obliq.jpg


Note that the time coordinate is thousands of years from the year 2,000, so “0″ is today and “-10″ is 10,000 years ago, or 8,000 B.C.

Another important factor affecting the arctic is precession; this is a combination of the eccentricity of earth’s orbit (how much it differs from a perfect circle) and the time within the seasonal cycle at which we get closest to the sun. When we’re closest to the sun (”perihelion”) during midsummer, the arctic gets a roaring amount of summer solar energy, but when we’re furthest from the sun (”aphelion”) during midsummer, arctic summertime insolation is strongly muted. The precession factor was also in decline for about 10,000 years, although it bottomed out in the last few thousand years:


precess1.jpg


It’s worth noting that although precession strongly influences arctic sunlight during summer, it has no effect on the average throughout the entire year. It’s also worth noting that when the precession factor is high, the arctic gets more summertime solar heat but the antarctic gets less; precession affects the two poles oppositely. In contrast, obliquity affects the two poles in the same way, and also affects the annual average of incoming solar energy at the poles.

Astronomers have computed the relevant aspects of earth and its orbit (obliquity, eccentricity, precession) for millions of years in the past and future. From these data we can compute the amount of incoming solar energy at any given latitude for any day of the year. A common choice of latitude which is relevant to the growth and decay of ice sheets (and hence the progress of ice ages) is 65N. Here’s the insolation (incoming solar energy in Watts per square meter) at latitude 65N on midsummer day, from 10,000 BC to 4,000 AD (from 12,000 years ago to 2,000 years into the future):

midsum65.jpg


Here’s the annual average insolation at latitude 65N:


annual65.jpg


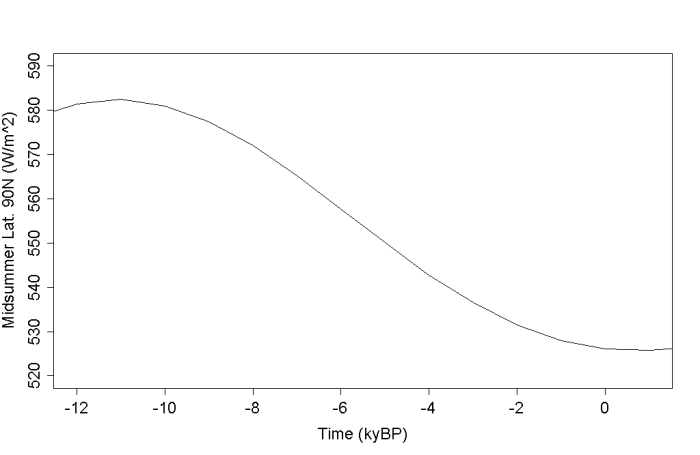
We can likewise compute the midsummer-day insolation at the pole itself:

midsum90.jpg


And here’s the annual average insolation at the pole:

annual90.jpg


The entire arctic has experience a decline in incoming solar energy, both on midsummer day and averaged throughout the year, since about 8,000 B.C. No wonder the arctic has been cooling!

If not for the greenhouse gases we’ve pumped into the atmosphere from burning fossil fuels, the arctic would still be cooling. But it’s not — it is most definitely warming. Fast. The yahoos who claim otherwise have only embarrassed themselves.


http://tamino.wordpress.com/2009/09/08/arctic-sunlight/
 
Olá Vince, eu acho que a pequena idade do gelo foi causada pelo mínimo solar, correntes oceânicas ou outras causas, mas não por vulcões.

Do que eu sei, a maioria das grandes erupções tem efeitos que duram apenas alguns anos, como o caso das anomalias de 536, de 1317, do Laki, ou do Tambora. Embora não rejeite a hipótese que uma destas possa mudar o curso do clima durante as décadas seguintes, de uma maneira mais subtil, por assim dizer.

A "coincidência" dos mínimos solares e dos períodos frios, parece muito favorecer a explicação do factor solar.
Aliás não é só no período 1300-1850 mas tb no máximo quente medieval, no mínimo frio entre 400-700, no máximo romano, etc.
Talvez o forçamento solar cause gradualmente mudanças oceânicas e nas calotes.

No nosso século já é claro ter que haver uma outra variável, que no entanto não quer dizer que seja a humana. Pode ser outra variavel ainda desconhecida. Os últimos 20 anos é um tempo muito curto à escala geológica. Pode ser uma simples variação ocasional.

Uma das maneiras de confirmarmos isso seria reduzir a nossa actividade poluidora e ver o que acontece. Não só é uma grande experiência metereológica, como tb reestabelecemos o balanço natural, o que decerto é muito desejável.
Está tudo em aberto.

um hipotético mínimo solar prolongado, que ninguém consegue prever, certamente fará baixar as temperaturas, mas isso não significa que o aquecimento seja revertido ou que a teoria o AGA esteja errada. E é preciso não esquecer que a maioria dos estudos atribui muito mais aos vulcões o arrefecimento da pequena idade do gelo do que aos mínimos solares. Eu quando digo que vivemos tempos fascinantes quero dizer que o problema disto tudo é que não podemos fazer experimentação com o clima, e se a natureza nos resolve servir um mínimo solar diferente do das últimas décadas isso será precioso para validar teorias e modelos, tal como tem sido por exemplo algumas erupções vulcânicas. Ciência é um processo contínuo, e pode perfeitamente haver erros, e um mínimo solar mais prolongado pode ajudar a validar algumas coisas.